What is PerfStack?
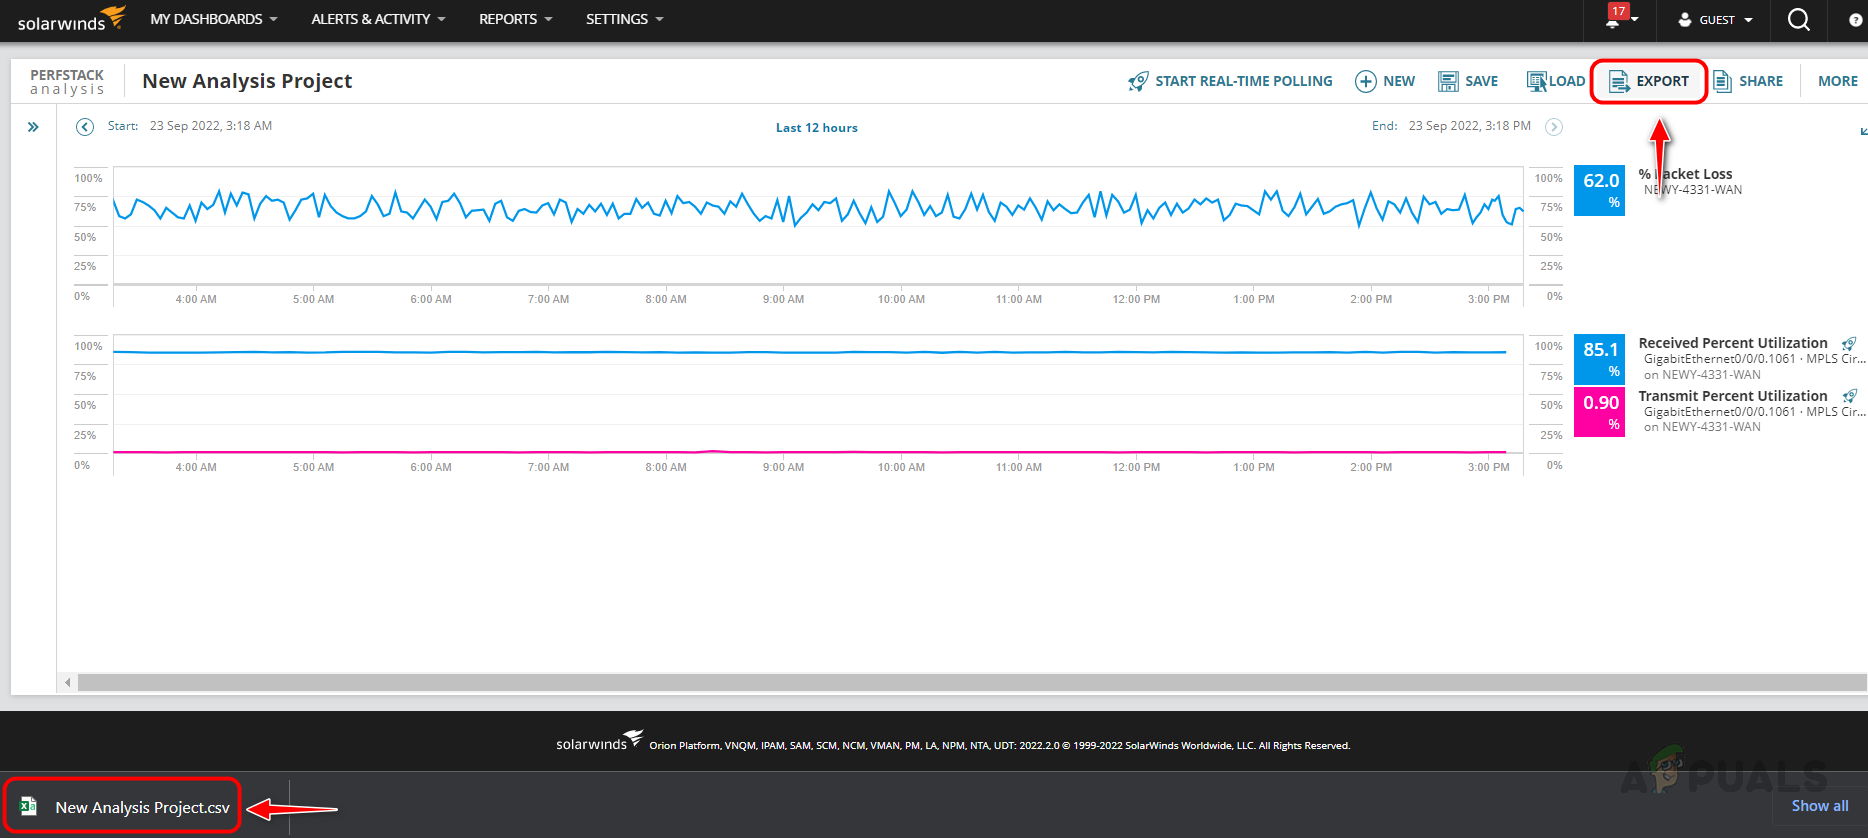
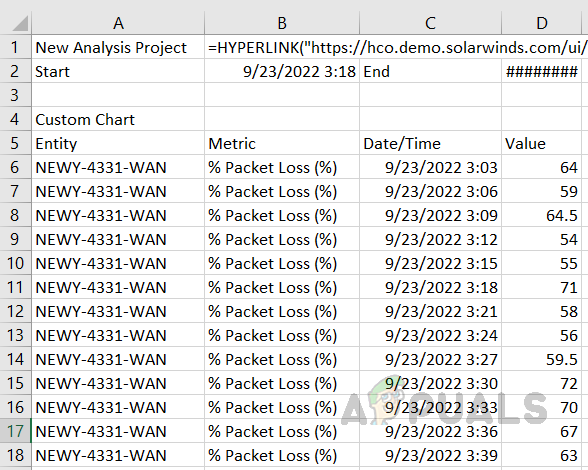
PerfStack is a data correlation feature with most of the Solarwinds Orion modules. With PerfStack, we can correlate multiple data metrics side by side on a common timeline in a single pane. This can be shared with different teams; this gives the ability to collaborate with other functional teams. Also, PerfStack data can be exported as raw data to better look at the data. Click on this link to learn more about PerfStack and download the product.
How to User PerfStack for Data Correlation
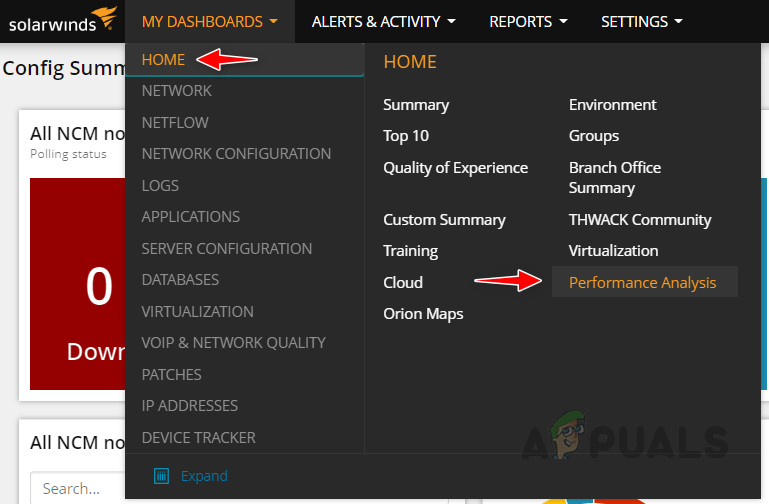
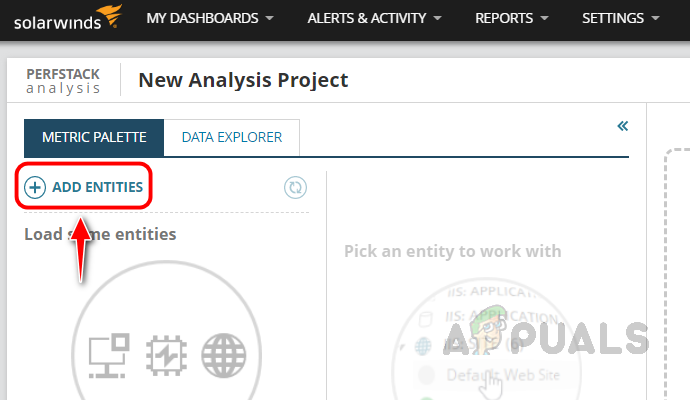
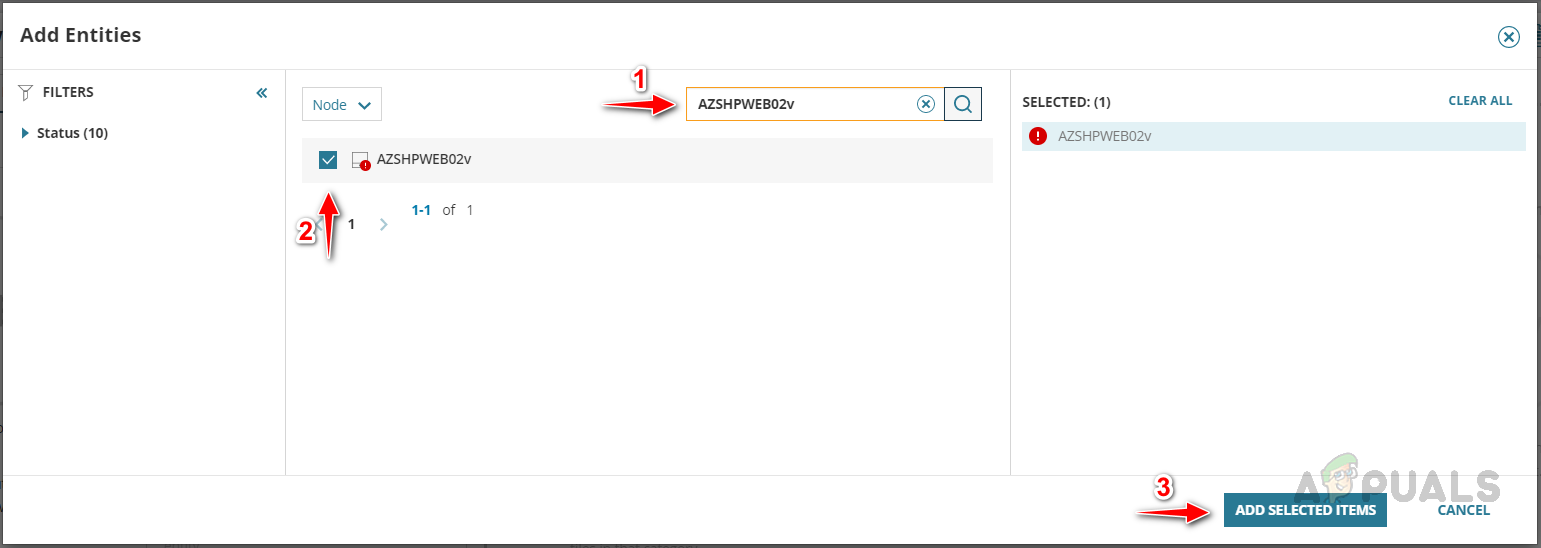
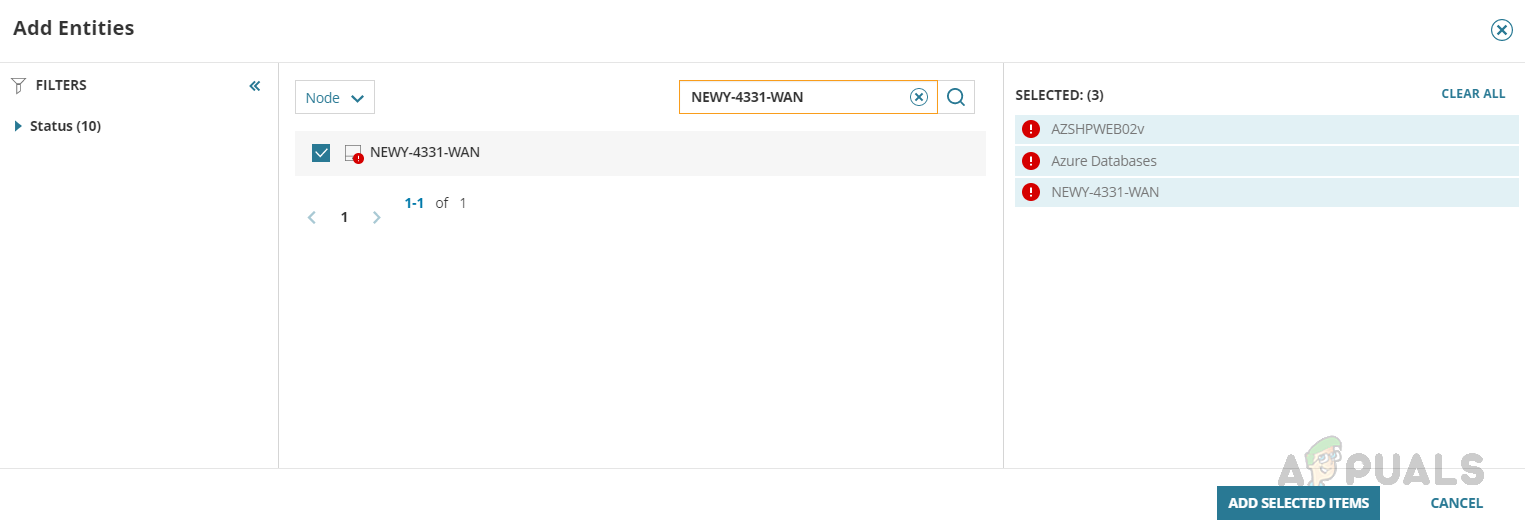
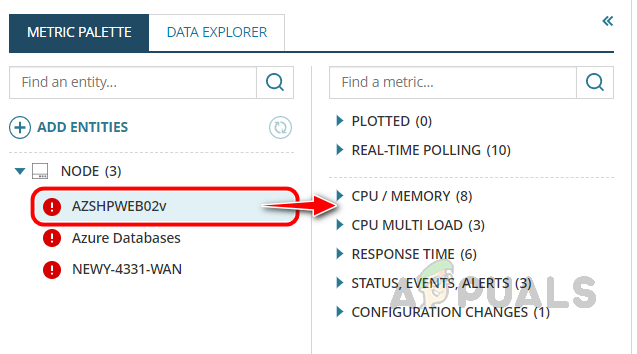
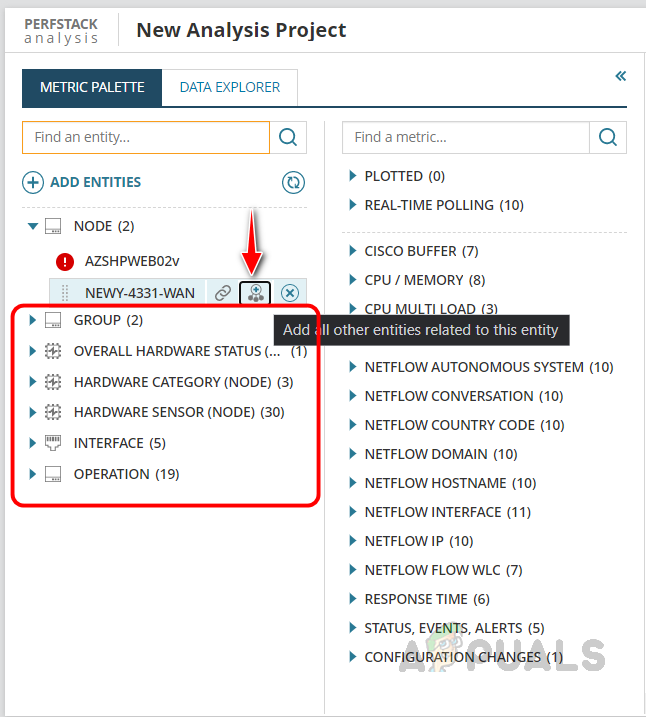
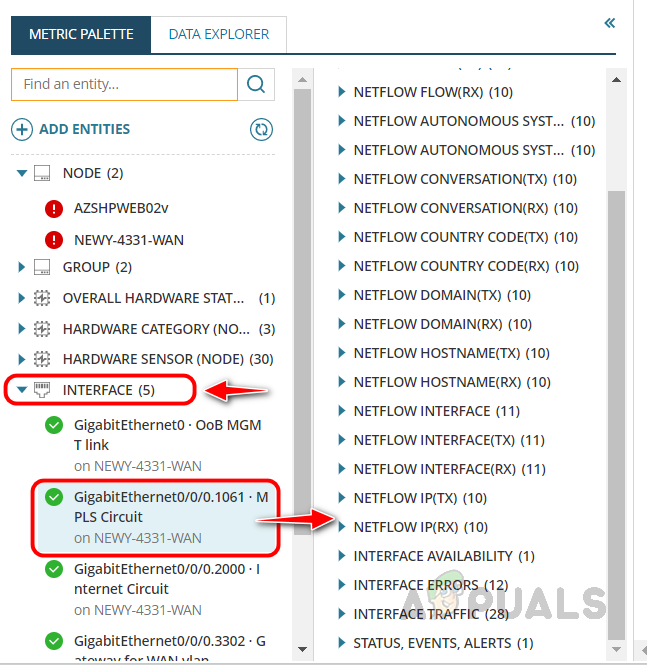
PerfStack comes with most of the Solarwinds Orion Modules. Below is the list of modules with the PerfStack feature. Network Performance Monitor NetFlow Traffic Analyzer Server & Application Monitor Storage Resource Monitor Virtualization Manager Web Performance Monitor Now let’s see how to use PerfStack for data correlation. This is how we can use the PerfStack feature to identify the cause of a performance-related issue. If we have modules like NPM, NTA, SAM, and NCM in an integrated environment, we can use those metrics inside PerfStack to get further clarity on the issue. This will help us drill down to identify the exact cause of the problem. Once we identify the reason, the issue can be fixed quickly. We can work on how to prevent and avoid the issue again by setting proactive alerts using Solarwinds advanced alerting feature.
How to Monitor and Troubleshoot Active Directory Performance Issues?Fix: ’ea.com unable to connect’ Troubleshoot Connection IssuesTroubleshoot Intel Dual Band Wireless-AC 7260 Connectivity IssuesHow to Troubleshoot PDF Printing Issues
