The question to ask here is, how can you monitor the configuration changes made to the servers? A server’s configuration can be altered anytime by one of the sysadmins and since a large network requires much more administrators, pinpointing the cause can be equal to finding a needle in a haystack. The answer here is to use the Server Configuration Monitor tool. Solarwinds, the company behind SCM (Server Configuration Monitor), is an American company that provides networking and system management services and also develops tools for the said purposes to help network and system admins. In this article, we will be showing you how to deploy the tool on your system and then provide step-by-step instructions to start monitoring your server configurations.
Installation of Server Configuration Monitor
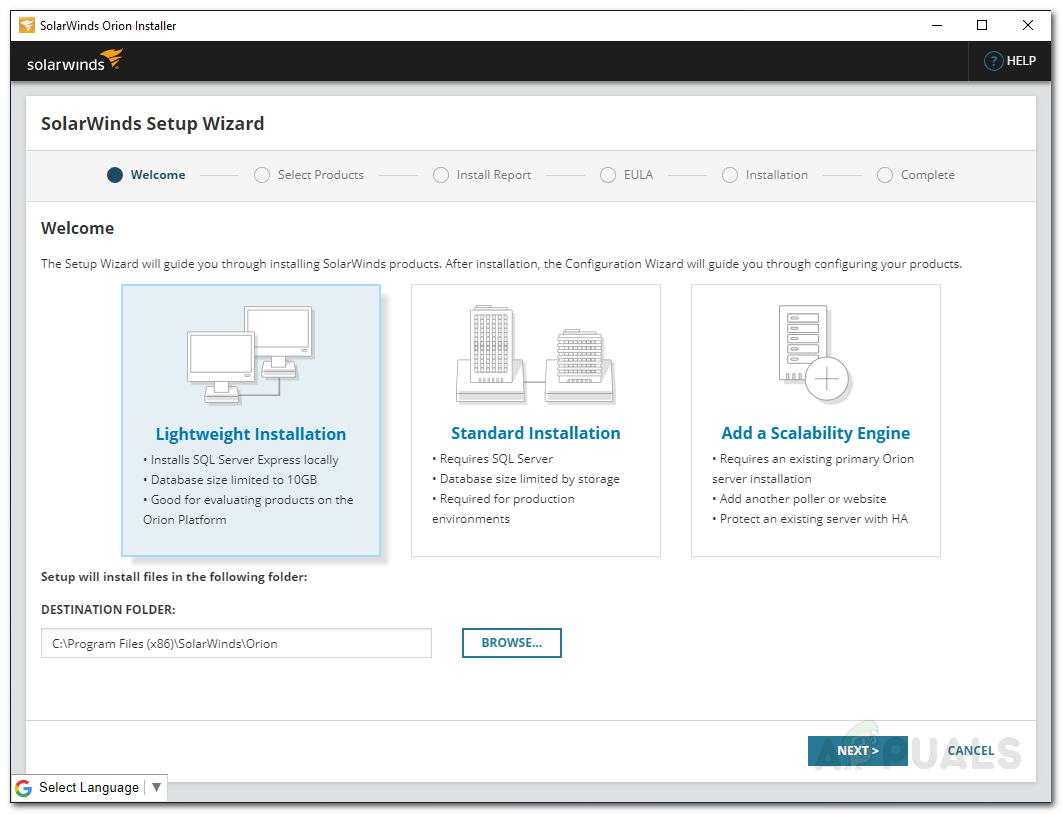
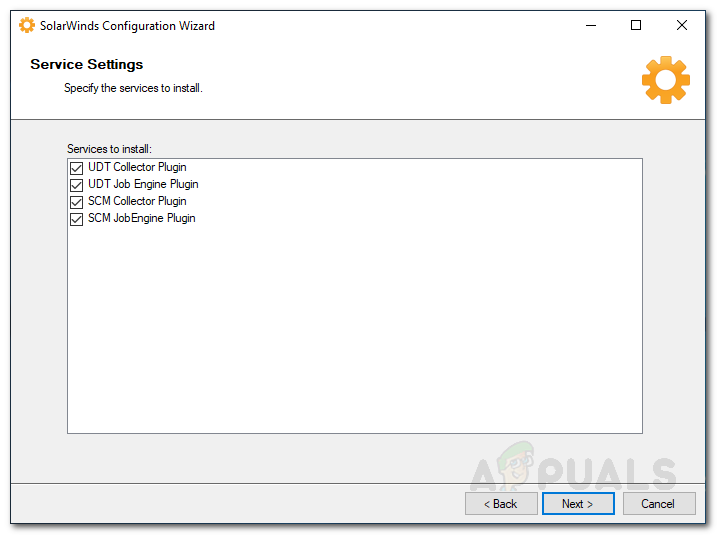
The installation part is really easy and simple as Solarwinds allows you to install the tool using Solarwinds Orion Installer. Orion is a suite of Solarwinds major network and system management tools like NPM, SCM, IPAM using which you can install the tools you desire without any difficulty. To download the tool, head to this link and provide the required information and then click ‘Proceed to Free Download’. After that, follow the instructions given down below:
Discovering your Network
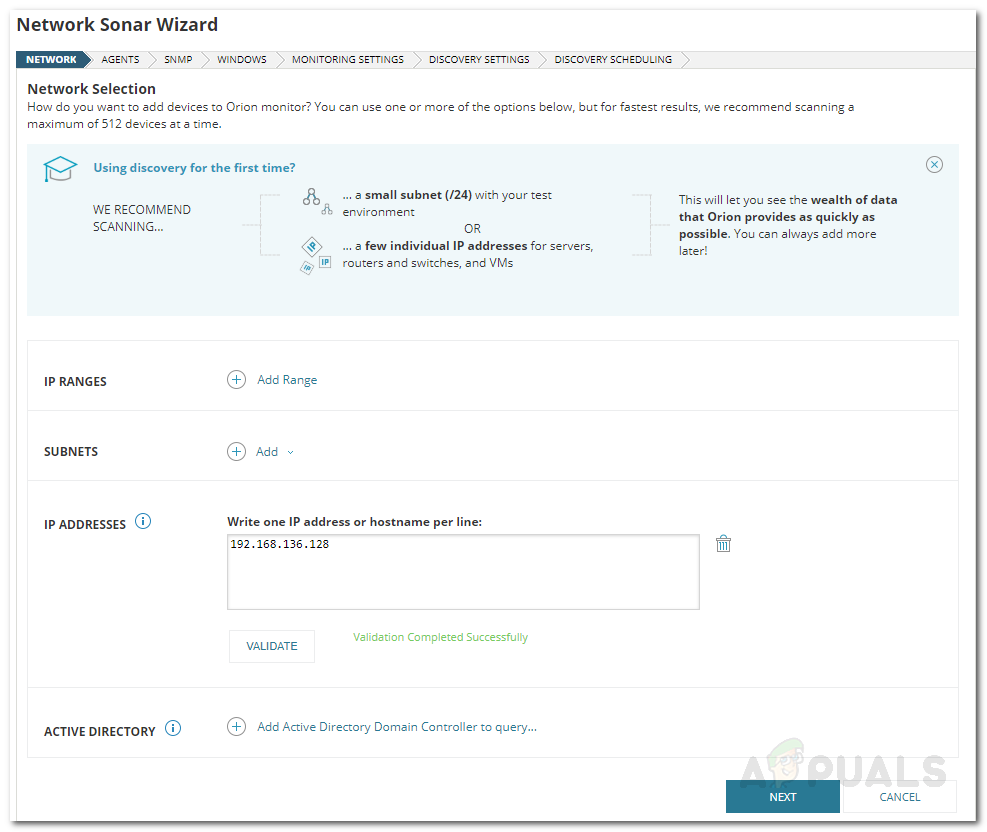
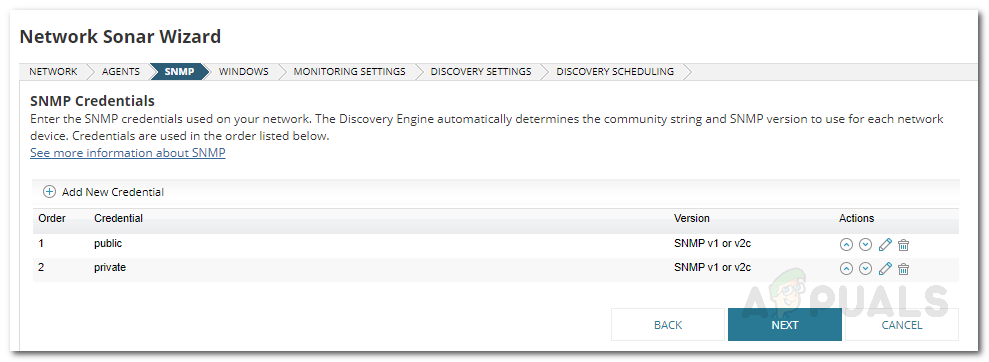
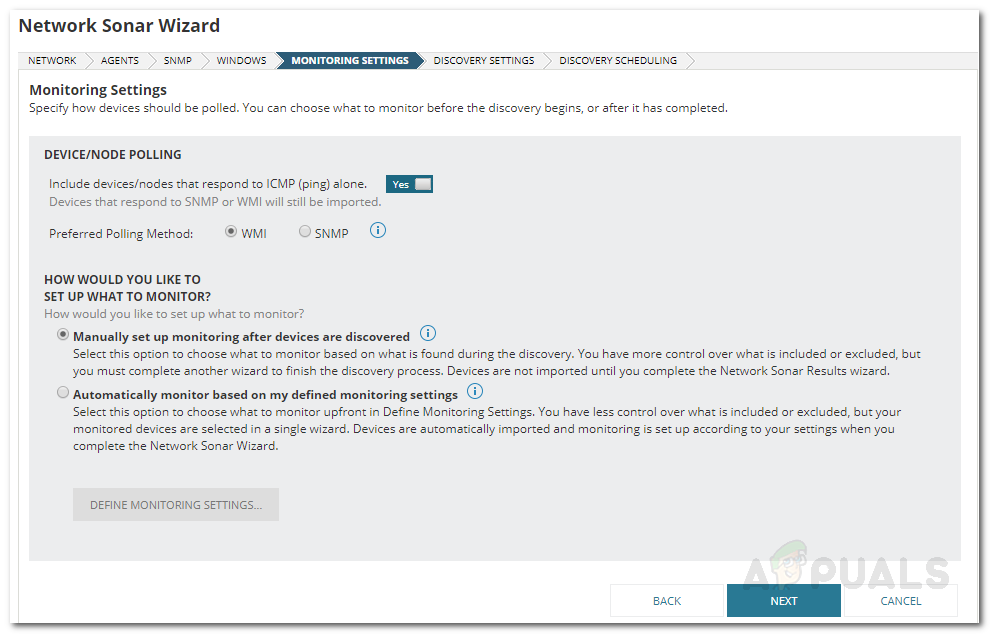
Now that the tool has been deployed on your system successfully, you will have to discover your network using the Orion Web Console. The console comes with a Network Sonar Wizard that lets you discover your networks easily. Here’s how to do it:
Importing Discovered Devices
Once the Network Sonar Wizard completes, you will be taken to the Network Sonar Results Wizard. Here, you will be able to see the devices that have been discovered by the wizard. Now, it is time to import them. Here’s how to do it:
Enabling Real-Time File Monitoring
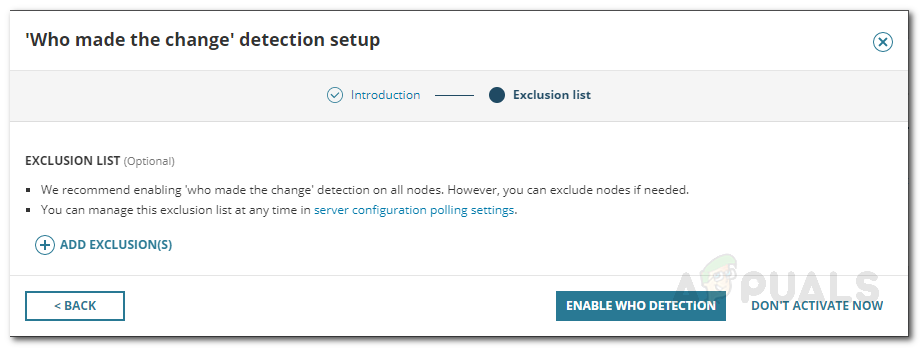
Server Configuration Monitor enables you to monitor your server configurations and also see which user made what configuration changes. To enable this, follow the instructions given below:
Managing Profiles
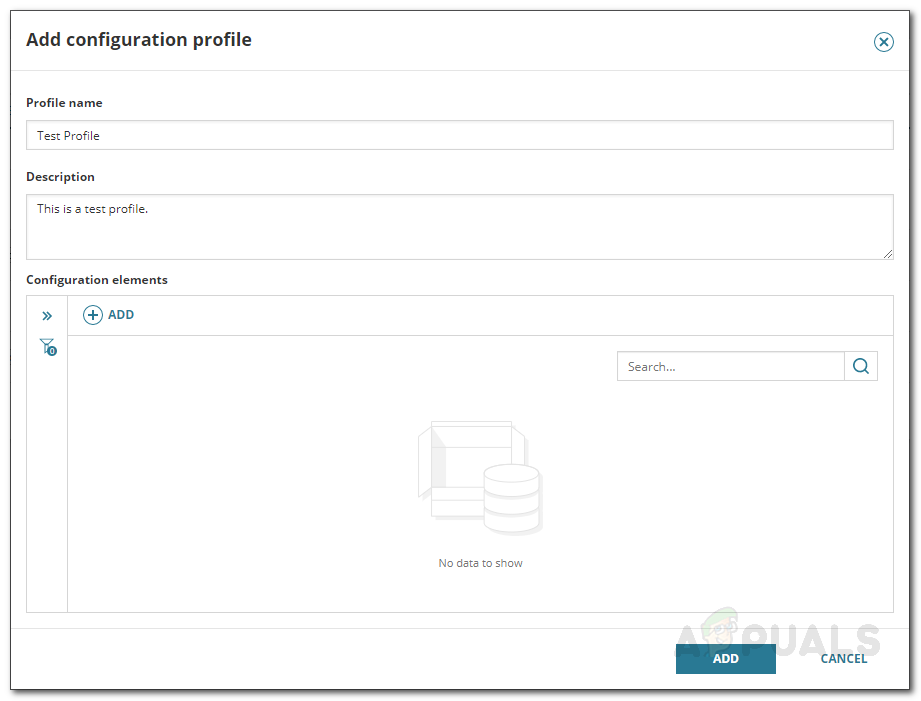
SCM comes packed with several predefined profiles that you can configure as well as add new custom profiles per your needs. To manage profiles, do the following:
Start Monitoring
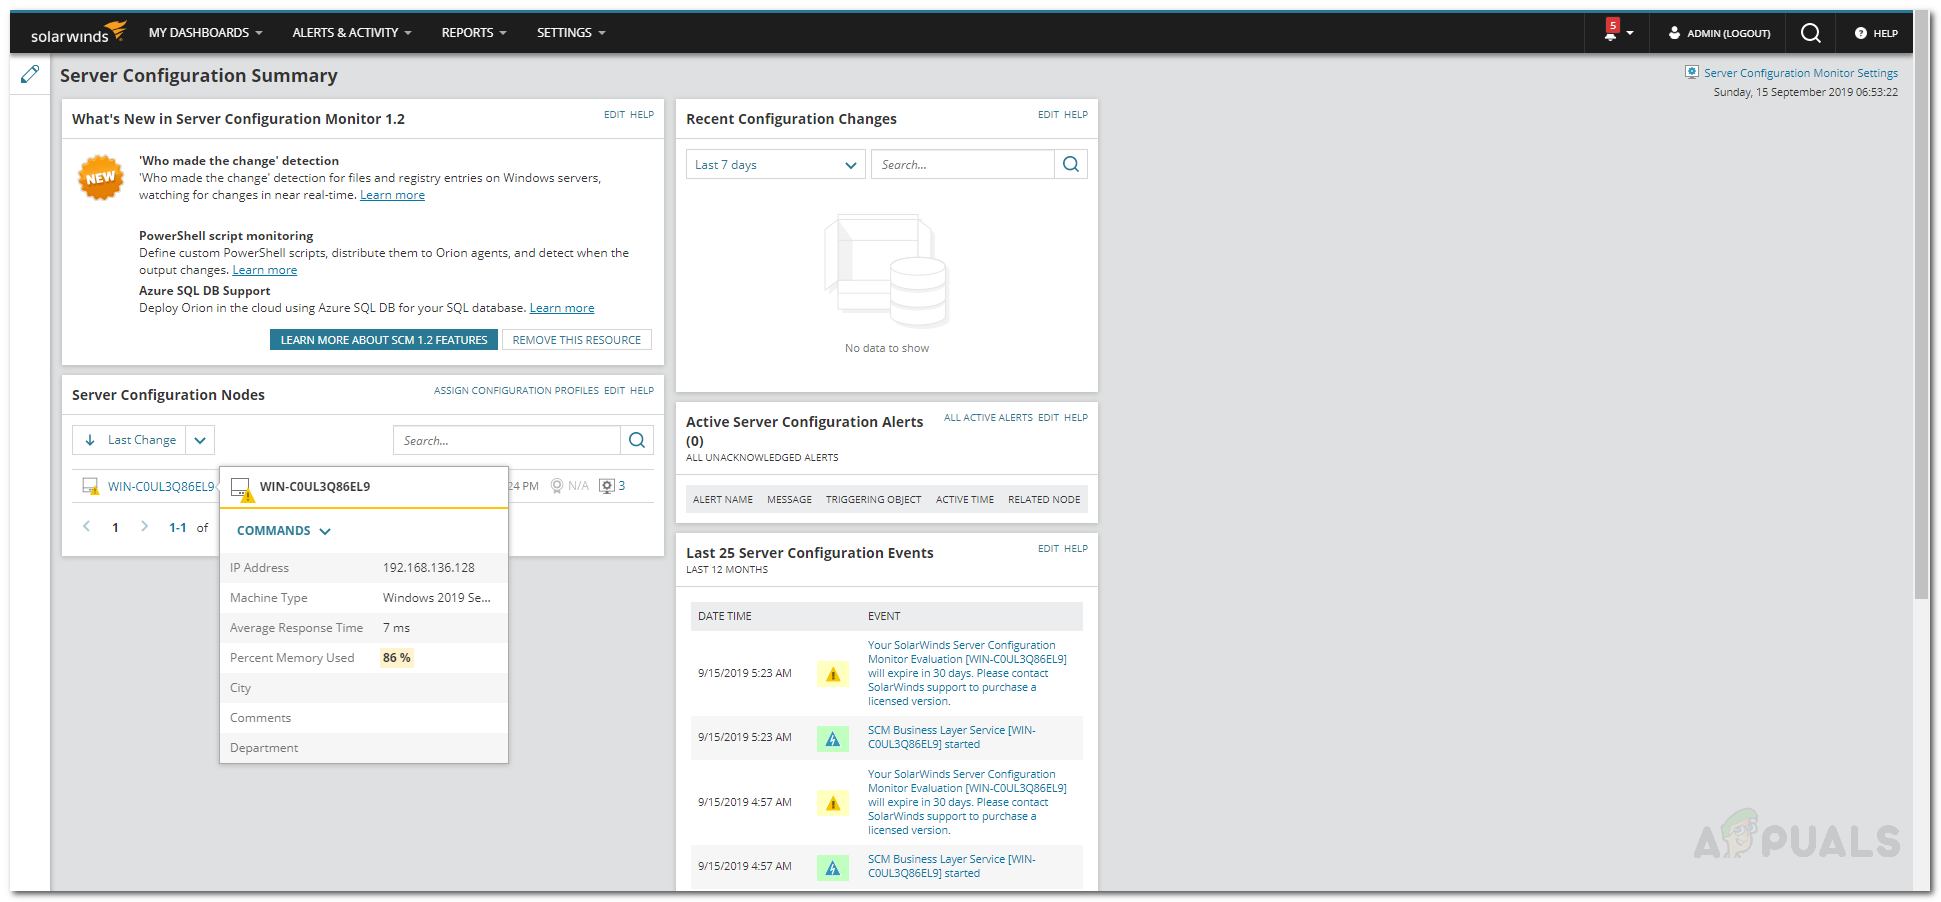
With that, you are all set and you can start monitoring the added nodes just from a computer screen. To open up the monitoring page, just navigate to My Dashboard > Server Configuration > Server Configuration Summary.
How to Create Custom Profiles and Monitor Specific Configuration Changes in…How to Monitor your Website using Website Performance Monitor?How to Monitor Cisco Devices using Network Performance MonitorHow to Monitor your Storage Resources using Storage Resource Monitor?
